There are two new commands for profiling Unison programs.
run.profiledwill run the program just likerun, but will display abbreviated profiling information at the end. It looks for the hottest spots in the program and shows just enough of a tree to display those hot spots.
run.profiled.fullis like the above, but takes a file name to write the complete profile to. There are two modes this can run in, based on the file name.- If the file name ends in
.ticks, then a file suitable for use with flamegraph.pl will be produced. This can be used to visualize the profile. - Other suffixes, like
.profwill just produce textual output, containing a table of identified hot spots, and a full tree of the recorded profile information.
- If the file name ends in
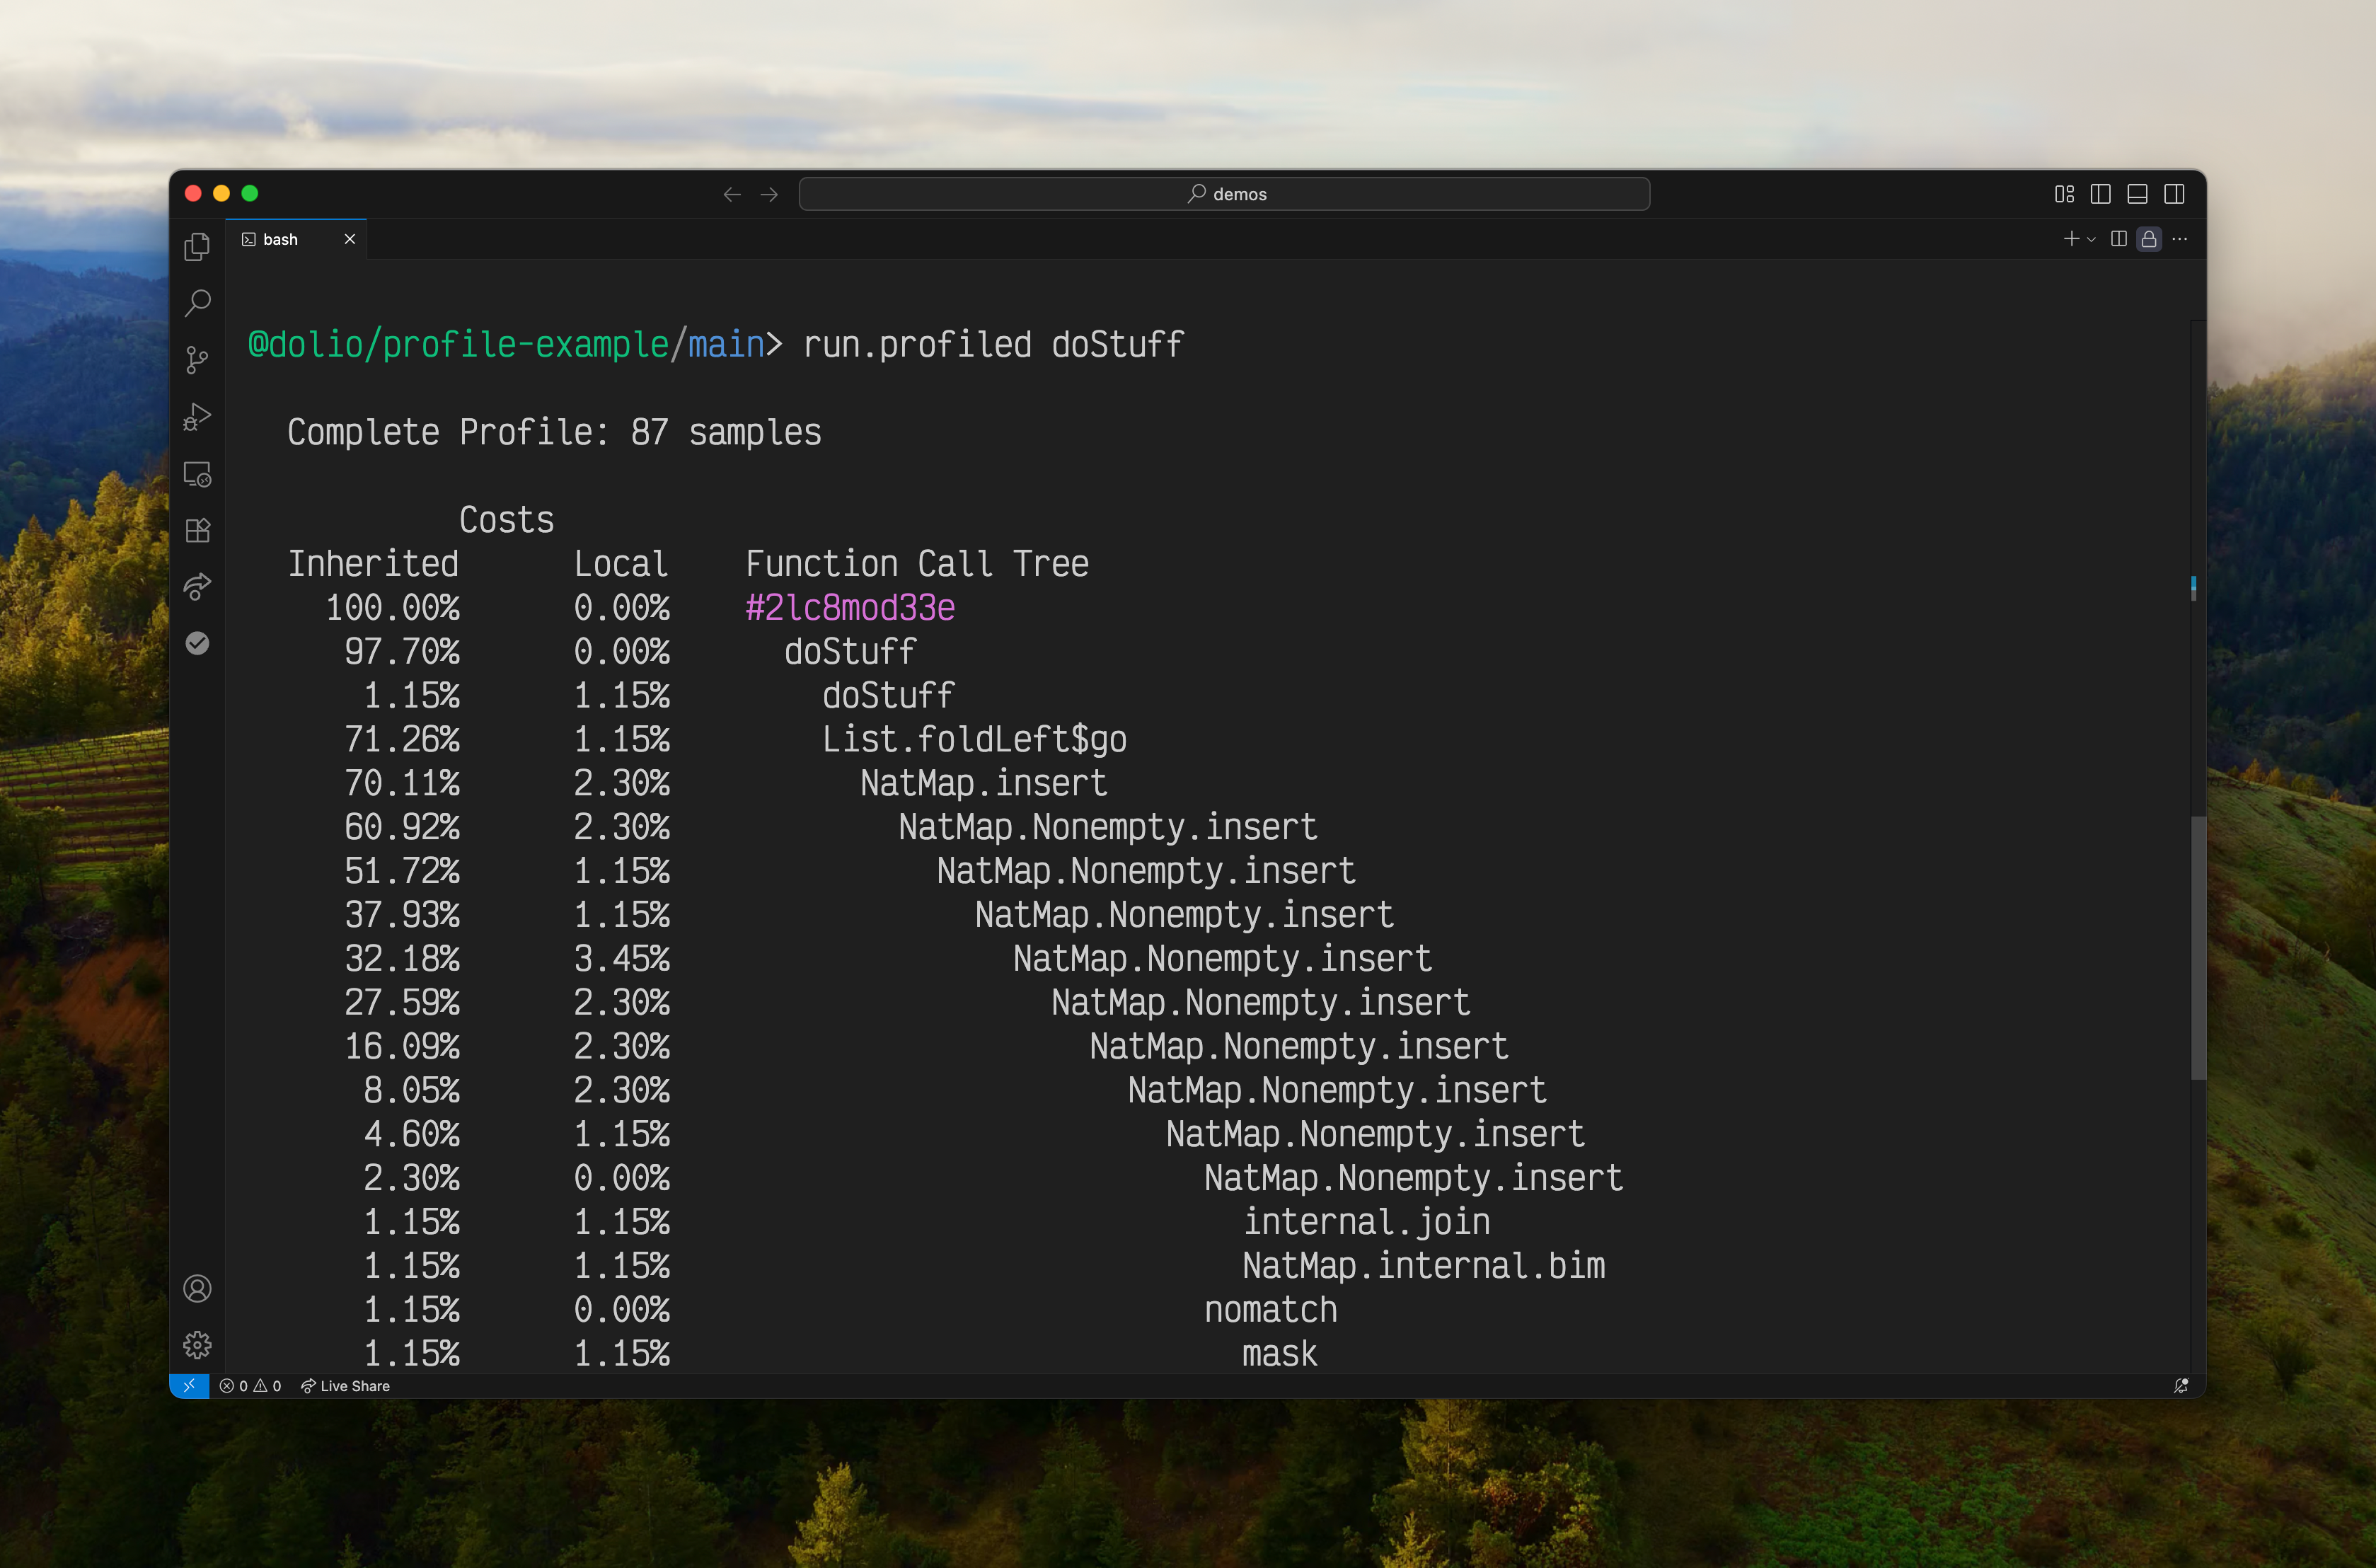
For instance, in the @dolio/profile-example project, executing
@dolio/profile-example/main> run.profiled doStuffwill produce output like
while,
@dolio/profile-example/main> run.profiled.full doStuff stuff.profwill result in a stuff.prof file that looks like:
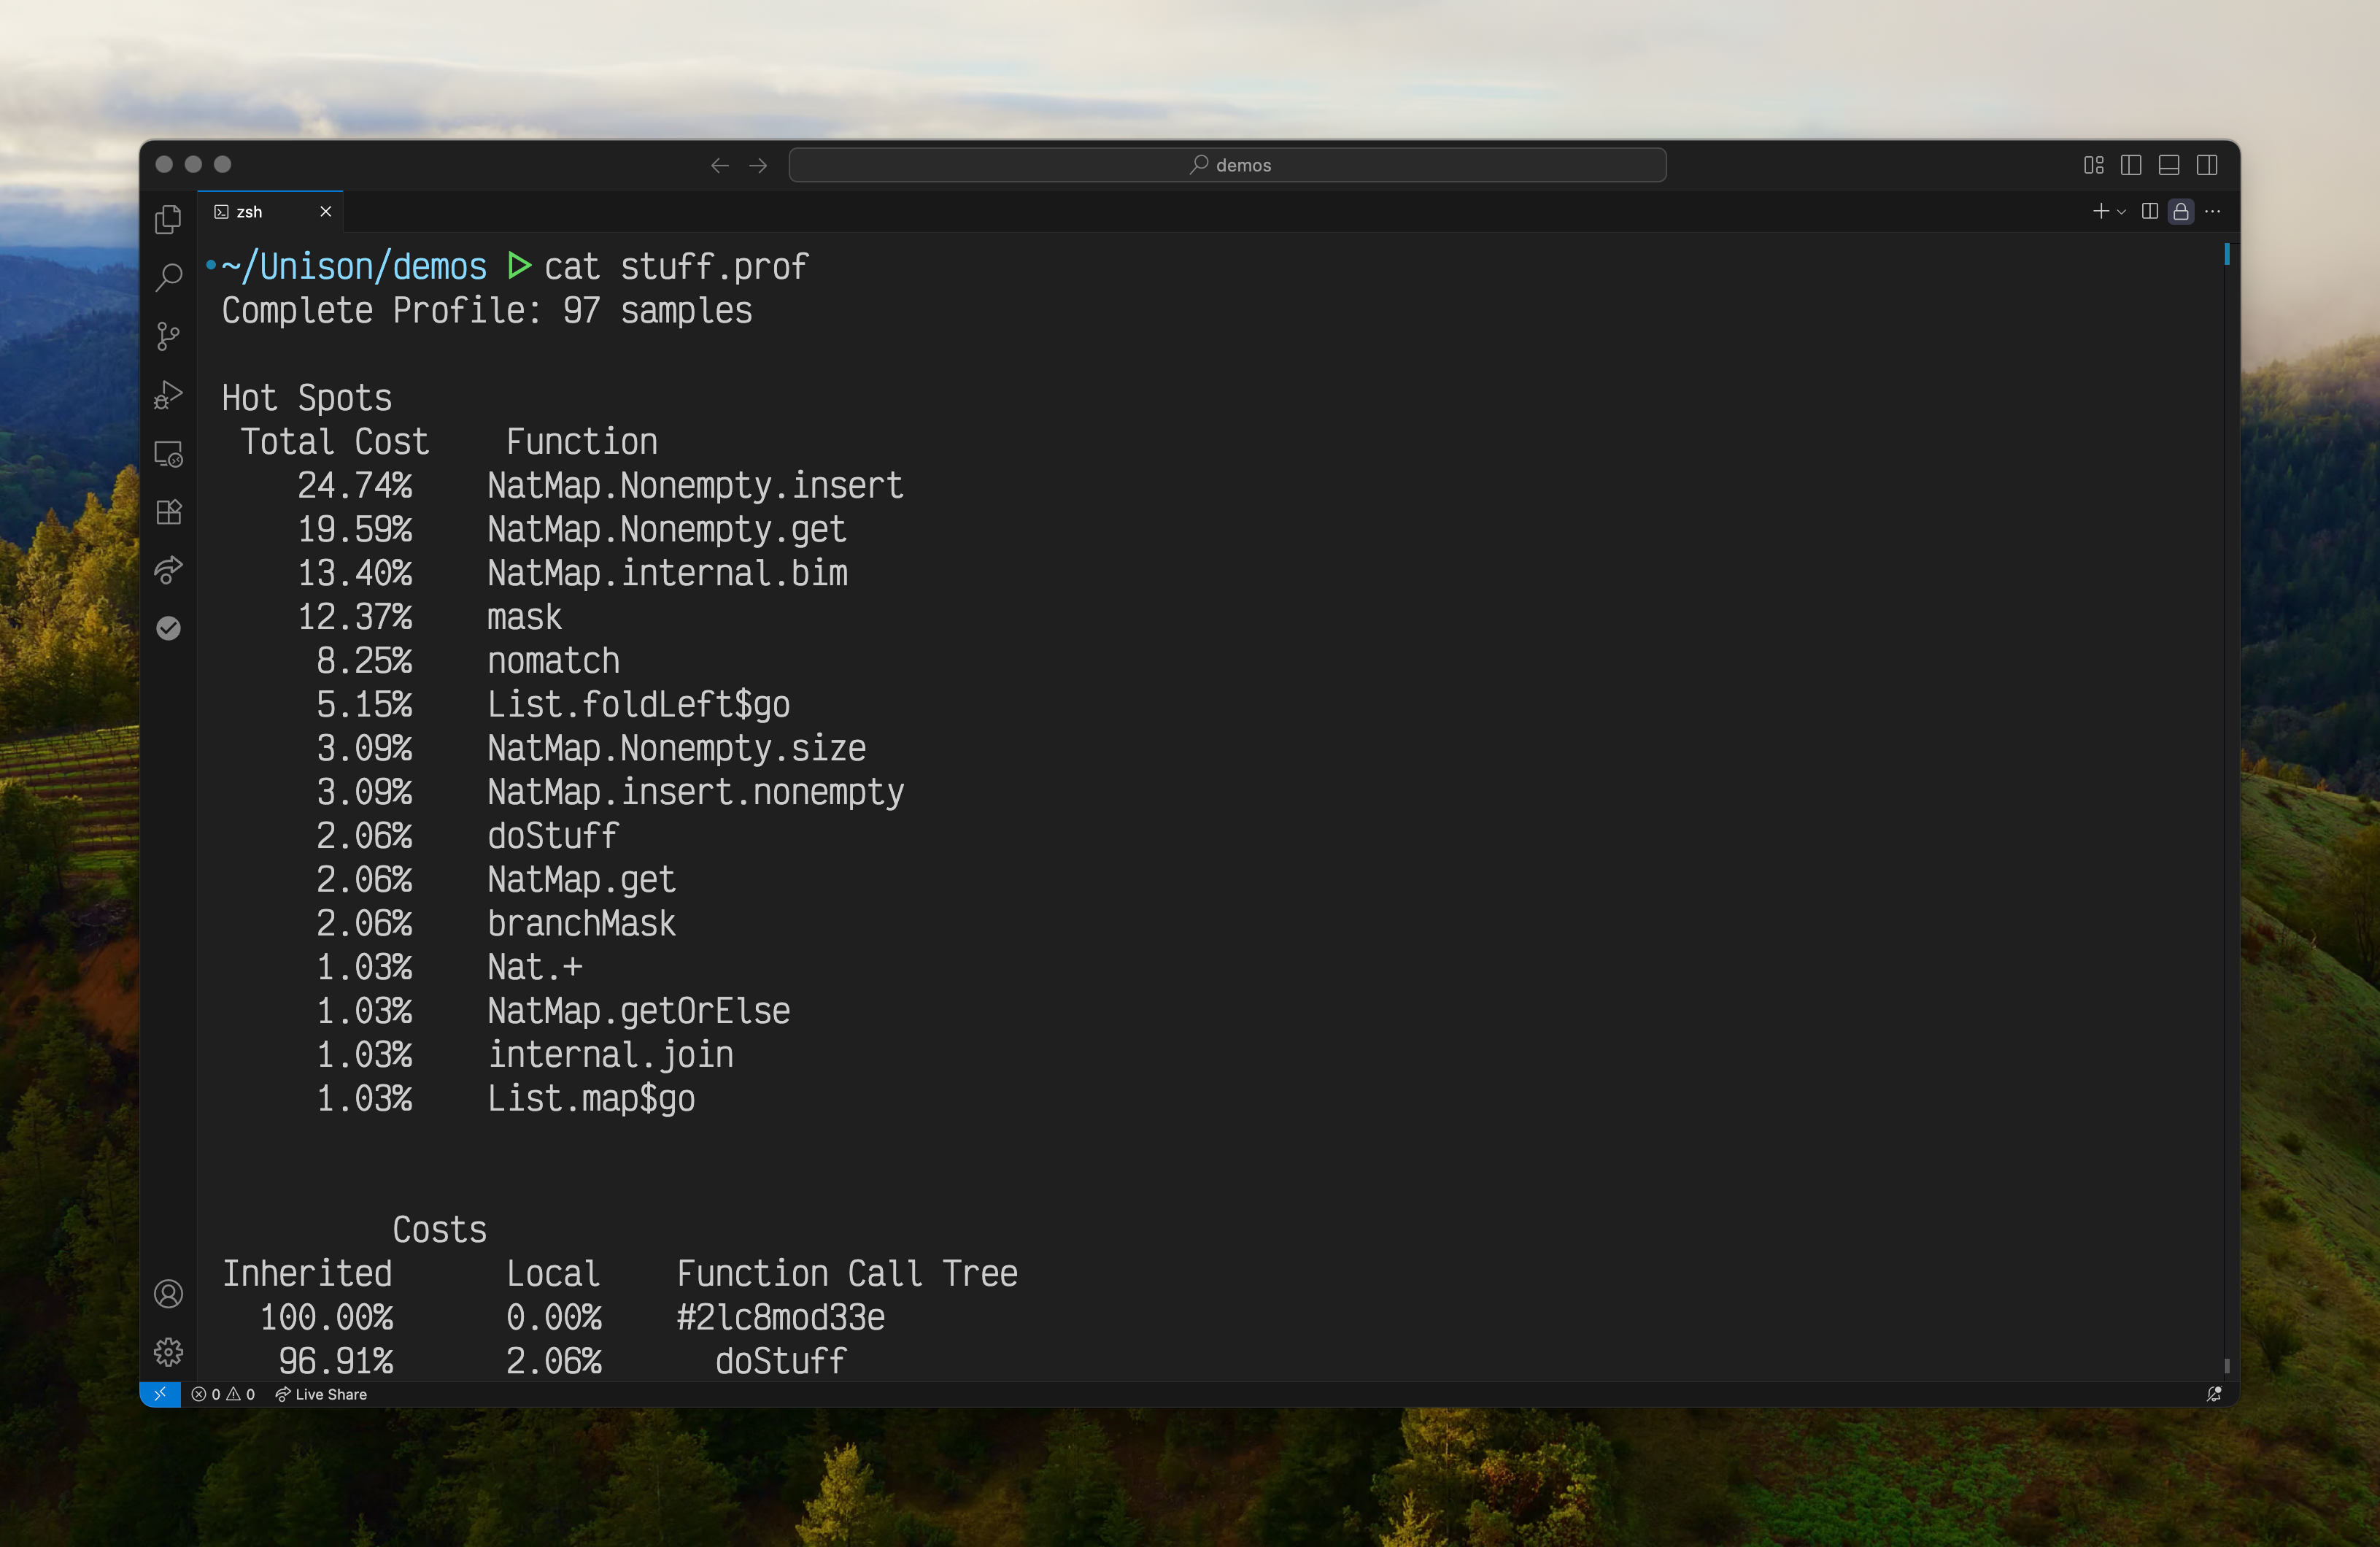
The "Hot Spots" table shows the total direct cost attributed to each function listed. The "Costs" tree displays how functions call one another, so a single function may occur multiple times, nested in different places. The "Local" column displays the direct cost attributed to that function, while the "Inherited" column shows the overall cost of the function and all its children in the tree.
Instead, executing
@dolio/profile-example/main> run.profiled.full doStuff stuff.ticksproduces a less readable file, but running flamegraph on it with
$ flamegraph.pl stuff.ticks > profiler-output.svgproduces an image like

which displays similar information to the "Costs" tree above.