
For the past few weeks, the Unison community has been working on creating a small library for visualizing the execution of distributed computations.
The library is being hosted on Unison Share here! This effort was inspired, in part, by the challenges we've written about in our earlier Spark-like distributed datasets article when it comes to tracking whether a distributed computation is being efficiently mapped and reduced before being awaited, or whether the computation is being forked and awaited with extraneous network hops.Here's one of those example map-reduce jobs with its visualization:
seqRegion : '{RemoteVis} Nat
seqRegion = do
  use Nat +
  Seq.fromListAt RemoteVis.region! 16 (Nat.range 0 128)
    |> Seq.map (x -> x + 1)
    |> Seq.reduce 0 (+)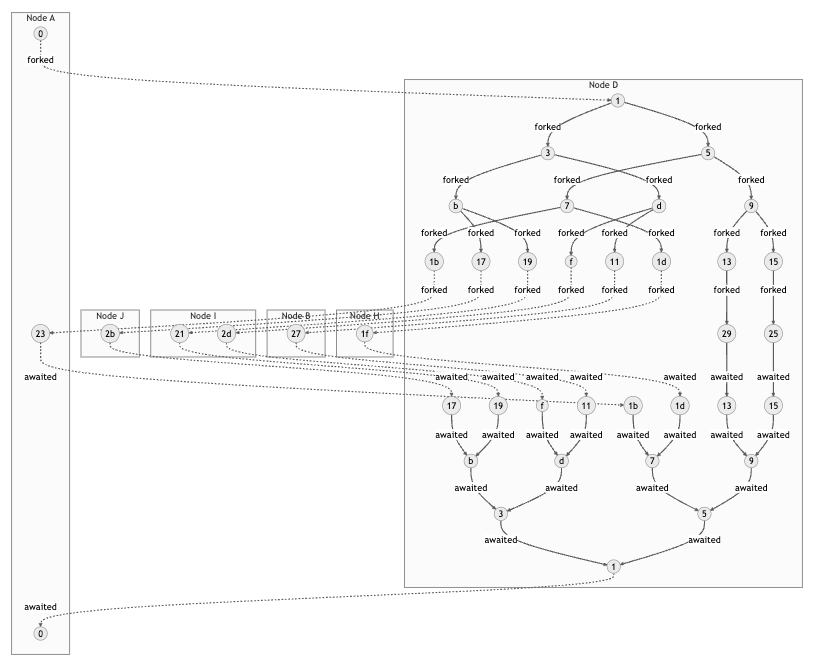
We can see that our map-reduce function creates a tree-like structure, with parent tasks forking child tasks and awaiting their reduced results. It's nice to see that our forked tasks aren't interleaved with calls to await, which might be a sign that we are unnecessarily waiting for results before forking more work, and we can see that the computation fans out to different locations only at the leaf nodes, where the map will be performed, minimizing extra data transfers.
These visualizations are generated upon running the program that they describe, and are designed to help users understand the behavior of their distributed program. The drawing we produce can be rendered and saved as a mermaid Doc element, which is viewable in Unison Share or the Local Codebase UI code browser. The library is still in its early stages, but we're excited to share what we've got so far.
Note, these drawings are not the same as a full observability tool for a distributed system. The nodes are labeled by their TaskId, not the values themselves, so this just gives us a sense of the "shape" of the computation. A production system would need to be able to handle thousands of potential events, and a diagram of such a computation would be too large to be useful. Our current goal is to create a tool that can help you understand the behavior of a small, locally run program, in the hopes that it enables easier adoption and learning.
With that in mind, here's a taste of what the library can do.
Drawing Remote primitive operations
In Unison, you can send a program to a remote node and run it asynchronously there with fork, and you can wait for the result of a remote computation with await.
fork :
   Location g -> '{g, RemoteVis, Exception} t ->{RemoteVis} Task t
 fork loc a =
   RemoteVis.forkAt (RemoteVis.near loc RemoteVis.here!) a
await : Task a -> {RemoteVis} a
await t =
RemoteVis.reraise (RemoteVis.tryAwait t)The first argument to fork is an abstract node in the system, represented by a Location type, and the second argument is the program to be run on that node. Awaiting a remote computation will block until the result is available.
Here's what you might see if you fork a few computations and await them locally, in the same location:
example2 : '{RemoteVis} Nat
  example2 = do
    task1 = forkAt here! '(1 + 1)
    task2 = forkAt here! '(2 + 2)
    a1 = await task1
    a2 = await task2
    a1 + a2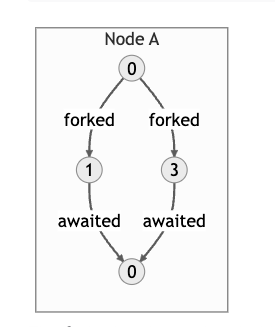
The forked tasks are labeled by their auto-generated task id.
And here's what you might see if you fork the following computations to be run on 3 random nodes, each with their own location subgraph, and later await them:
multipleLocations : '{RemoteVis} Nat
multipleLocations = do
     task1 = fork region! '(1 + 1)
     task2 = fork region! '(2 + 2)
     task3 = fork region! '(3 + 3)
     await task1 + await task2 + await task3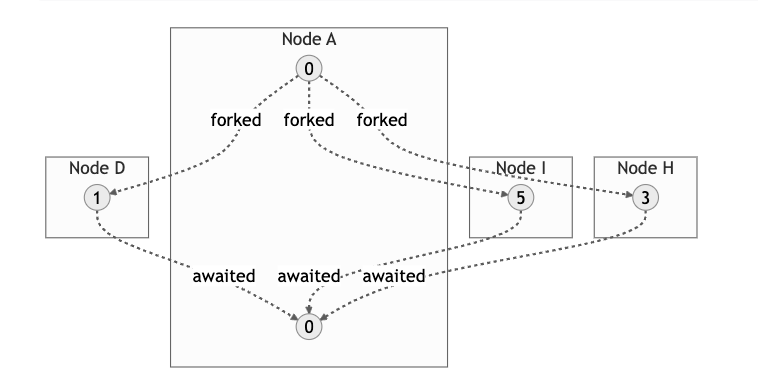
Time flows roughly from top to bottom and we can see that these tasks are running "asynchronously" because no intermediate "awaiting" by the root node is being performed between the "fork" arrows.
In light of this, it's much easier to spot the difference between a non-blocking remote program:
simpleReduce : '{RemoteVis} Nat
simpleReduce = do
   task = fork RemoteVis.region! do
     task1 = fork here! '(1 + 1)
     task2 = fork here! '(2 + 2)
     await task1 + await task2
   await task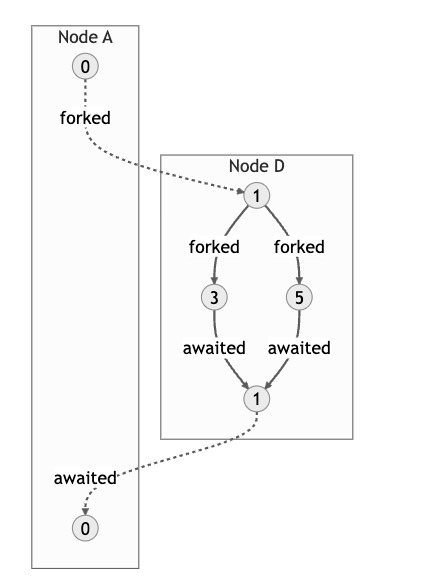
And its blocking counterpart:
blockingReduce : '{RemoteVis} Nat
blockingReduce = do
    task = fork RemoteVis.region! do
      res1 = await (fork here! '(1 + 1))
      res2 = await (fork here! '(2 + 2))
      res1 + res2
    await task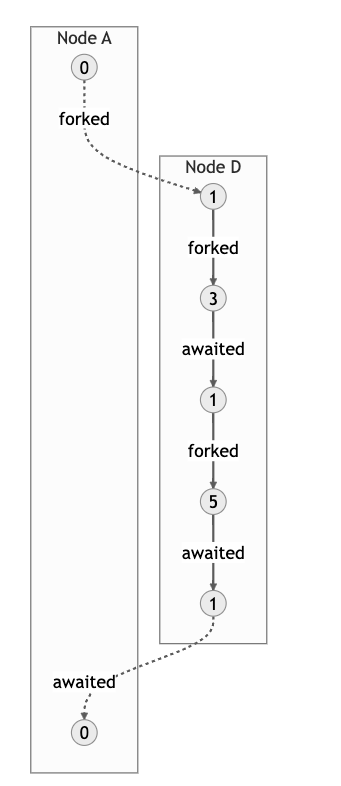
Tasks which are sent across location boundaries are particularly interesting for working with the distributed library because they represent a potential network hop. They're represented by dashed arrows or labeled subgraph boxes.
Thus far, the diagrams can be configured to render the following:
- The task id for each task
- The size (after compression) of the payload of each task
- The location of each event, represented by a sub-graph in the diagram
- Task cancellation, to observe orphaned tasks that are consuming resources
Technical details
Three core things make these programatic drawings possible:
- "Remote" computations are expressed as an ability, meaning that your distributed programs are defined in terms of an an interface that doesn't depend on the underlying backend that runs them.
- Community member Alvaro Carrasco has written an impressive library for modeling different kinds of mermaid diagrams, so it's possible to create diagrams natively, using Unison data types instead of working with raw strings. Check it out on Unison Share here!
- The Unison language has a "live" documentation format. Unison code can be directly rendered as documentation and is automatically updated when the underlying source code is updated.
Distributed computations as an ability
A full introduction to abilities is beyond the scope of this post, but to talk about how we're drawing these diagrams, we need to understand what Unison's effect management system, abilities, allows us to do. Ability handlers give us access to a snapshot of the running state of a computation. Every ability handler needs to decide how to resume the continuation of the program at the point in the program where the ability has been called. This means we can intercept an event like "Fork this program here" and store information about the task before performing the "fork" operation.
The distributed library has long had a local handler for the Remote ability called Remote.pure.run. This handler is used for testing and experimenting with a distributed program before it is deployed to a real distributed system via a backend like the one provided by Unison Cloud. It works by serializing the events that occur during the computation and storing their order relative to one another in a local task queue. There's no true concurrency happening when tasks are forked and awaited, so the local program may be considerably slower than one which runs in the Cloud.
We decided to use the Stream ability to emit events as they occur, in effect, creating a log of the distributed computation. This is another nice feature of Unison's effect system, one effect can be called in the context of another one, even when writing a handler for the effect. The core logic of a distributed program can be written in terms of just Remote, but our handler might be able to augment the runtime by writing a log line, emitting a drawing, or other effects.
We'll see the Stream and Remote effects included in the signature for our new local handler.
run.simple : Nonempty LocationId -> '{g, RemoteVis} a ->{g, Random, Scope s, Stream TraceEvent} Either Failure aWhen we want to produce the diagram, we fold over the Stream of events, collecting a mapping of task ids to the events that they produced. We use this accumulated state to draw the nodes and edges of the graph. Loosely, we wanted to draw a diagram whose semantics conveyed:
- The fork/await relationship between tasks
- When a task is forked across a location boundary
- A very rough sense of a task being "in progress" relative to others
- When a task has been cancelled, or just forked and abandoned
Mermaid diagrams as Unison values
The diagrams we produced are known as mermaid diagrams. Mermaid diagrams allow you to use markdown-like syntax to create a variety of diagram types. We've been using the Unison mermaid library by Alvaro Carrasco to write data types which represent the various entities like "subgraphs" and "arrows". The Unison mermaid library creates an ADT capable of representing the mermaid DSL and serializing it. This saves us from managing plain Text values like subgraph 4e6f64652041 ["Node A"] ourselves. Later, we transform the text blob produced from the library into a Doc value, which is Unison's documentation format.
Unison's live documentation format
The final piece to enabling this feature is Unison's own documentation format. Docs in Unison are themselves Unison values, represented by the Doc type. They can be saved and manipulated in the same way as any other Unison value.
The handler from Remote to Doc is relatively compact:
Remote.runToDoc : '{Remote} r -> Doc
Remote.runToDoc remote =
  flowchart = at1 <| runDiagram docDefault remote
Flowchart.toDoc flowchartFuture work
This library's overall goal is to make it easier for users of the distributed programming API to be able to reason about their program's control flow; we hope the increased visibility will be useful as the Unison Cloud races ever closer to general access. Rendering diagrams using the mermaid DSL in Unison's Doc format is a just first step towards a more general solution for visualizing remote computations. Future versions of the library might leverage SVG's directly and associate the computation source code in the task tree with nodes in a diagram. The current implementation is beholden to the conventions of the mermaid rendering engine, and the local interpreter isn't terribly performant for non-trivial scenarios. In the more distant future, we may be able to consume logging from actual events in the Cloud and write a custom debugging Stream handler for "tracer bullet" type traversals through a distributed system.
If you're interested in the work we've been doing on distributed programming in Unison, or if you have a specific project in mind that would be a good fit for running in the cloud, check out the Unison distributed programming library and tell us about it in the form for Unison Cloud beta access!